Bulk Deconvolution Benchmark
Tutorial 8 — Real BRCA pseudobulk evaluation with SpaCET vs MuSiC
Overview
This benchmark evaluates SpaCET's bulk deconvolution against MuSiC using real breast cancer single-cell RNA-seq data from Wu et al. 2021 (Nature Genetics, GSE176078). The dataset comprises 100,064 cells from 26 subjects across 9 cell types, providing a realistic foundation for evaluation.
A fair subject-level train/test split is used: 13 subjects form the reference panel and 13 held-out subjects are used exclusively for pseudobulk generation. Neither method sees the test-set cells during reference construction, ensuring a proper held-out evaluation without data leakage.
- SpaCET uses
deconvolution_matched_scrnaseq()with the train-set reference. - MuSiC uses the same train-set scRNA-seq as its reference, ensuring a level playing field.
- Four evaluation scenarios with diverse mixing ratios test complementary aspects of deconvolution accuracy.
1. Data and Split
The Wu et al. 2021 BRCA dataset (GSE176078) provides real single-cell RNA-seq from 26 subjects profiled across 9 major cell types. The subject-level 50/50 split ensures no cell from the test subjects can influence the reference profiles used by either method.
Cell type composition (full dataset)
| Cell Type | Cell Count |
|---|---|
| T-cells | 35,214 |
| Cancer Epithelial | 24,489 |
| Myeloid | 9,675 |
| Endothelial | 7,605 |
| CAFs | 6,573 |
| PVL | 5,423 |
| Normal Epithelial | 4,355 |
| Plasmablasts | 3,524 |
| B-cells | 3,206 |
| Total | 100,064 |
2. Pseudobulk Generation
Pseudobulk samples are constructed exclusively from the 13 held-out TEST subjects (2,000 cells per sample). Four scenarios probe different aspects of deconvolution difficulty:
| Scenario | Design | Samples |
|---|---|---|
| Uniform Dirichlet | alpha=1.0 — all cell types equally likely | 200 |
| Sparse Dirichlet | alpha=0.3 — sparse mixtures dominated by 1–2 types | 200 |
| Realistic Tumor Purity | 60–90% Cancer Epithelial, remaining types from Dirichlet | 200 |
| Malignant Titration | Cancer Epithelial fraction swept 0–90% in fixed steps | 100 |
The Uniform and Sparse scenarios test general deconvolution accuracy across the full composition space. The Tumor Purity and Titration scenarios are clinically motivated: most solid tumor biopsies are dominated by malignant cells, making accurate recovery of the immune and stromal minority the critical clinical challenge.
3. Results
Overall Pearson r between predicted and ground-truth fractions (all samples, all cell types pooled) is reported for each scenario. The Winner column identifies the method with higher r.
| Scenario | SpaCET r | MuSiC r | Winner |
|---|---|---|---|
| Uniform (alpha=1.0) | 0.84 | 0.88 | MuSiC |
| Sparse (alpha=0.3) | 0.92 | 0.95 | MuSiC |
| Tumor Purity (60–90%) | 0.96 | 0.90 | SpaCET |
| Titration (0–90%) | 0.94 | 0.86 | SpaCET |
4. Benchmark Figures
The following figures summarize deconvolution accuracy across all four scenarios. Scatter plots compare predicted versus ground-truth fractions at the per-sample, per-cell-type level. The comparison panel and per-type bar chart identify where each method gains or loses accuracy.
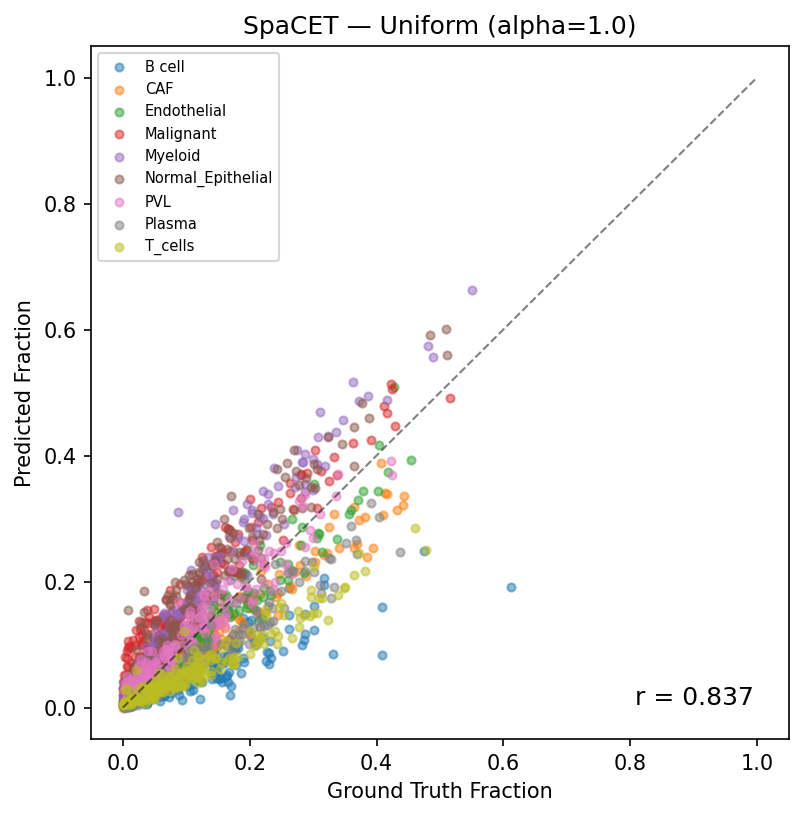
Predicted vs ground truth (Uniform Dirichlet, r=0.84). Each point represents one cell type in one pseudobulk sample. The dashed line indicates perfect prediction.
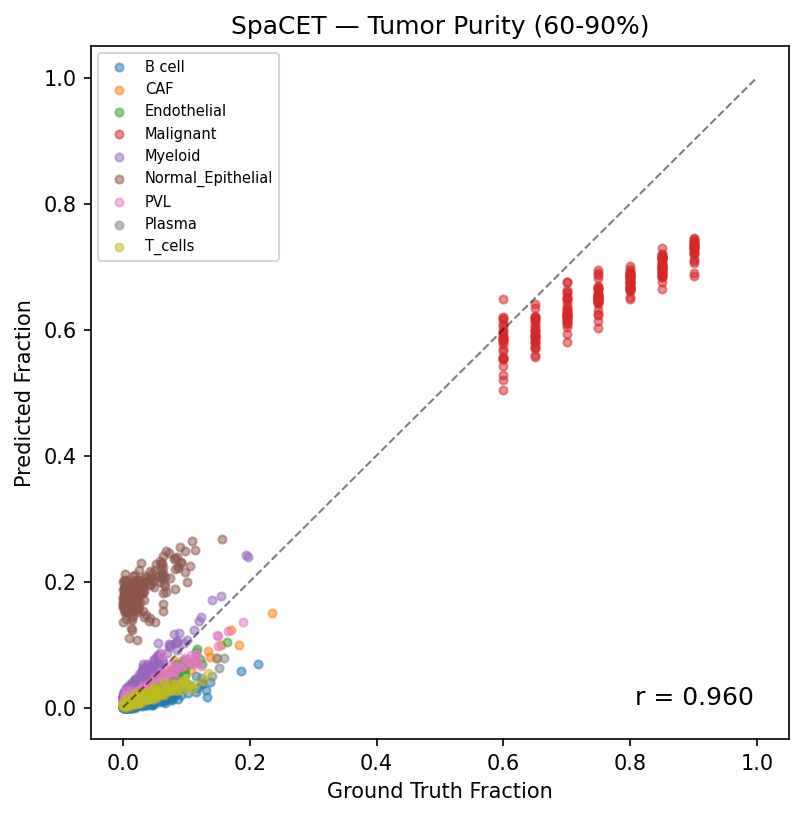
Predicted vs ground truth (Tumor Purity 60–90%, r=0.96). SpaCET maintains strong accuracy even as Cancer Epithelial dominates the mixture, correctly apportioning the residual immune and stromal fractions.
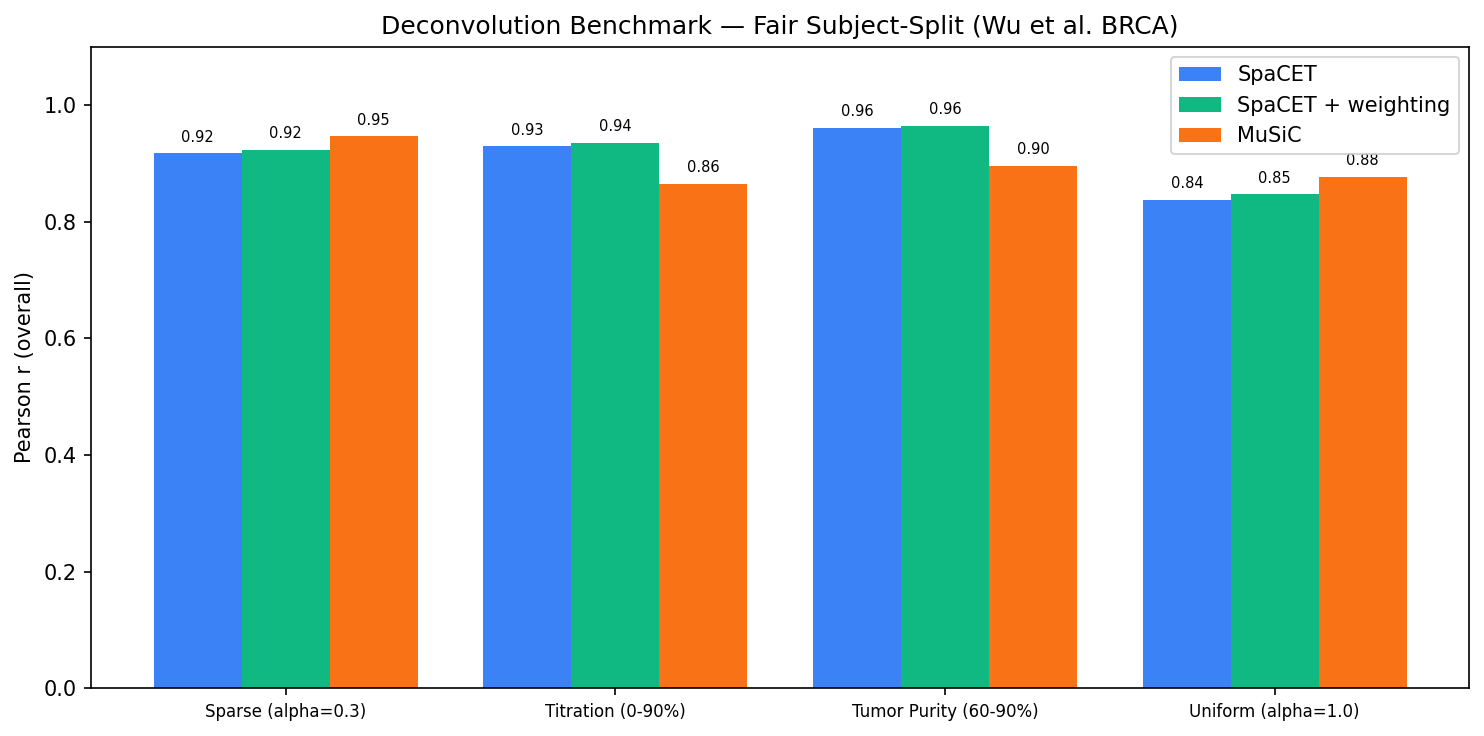
SpaCET vs MuSiC comparison across all scenarios. Each bar shows Pearson r for one scenario; methods are shown side by side. SpaCET leads on the two tumor-purity scenarios; MuSiC leads on the two Dirichlet scenarios.
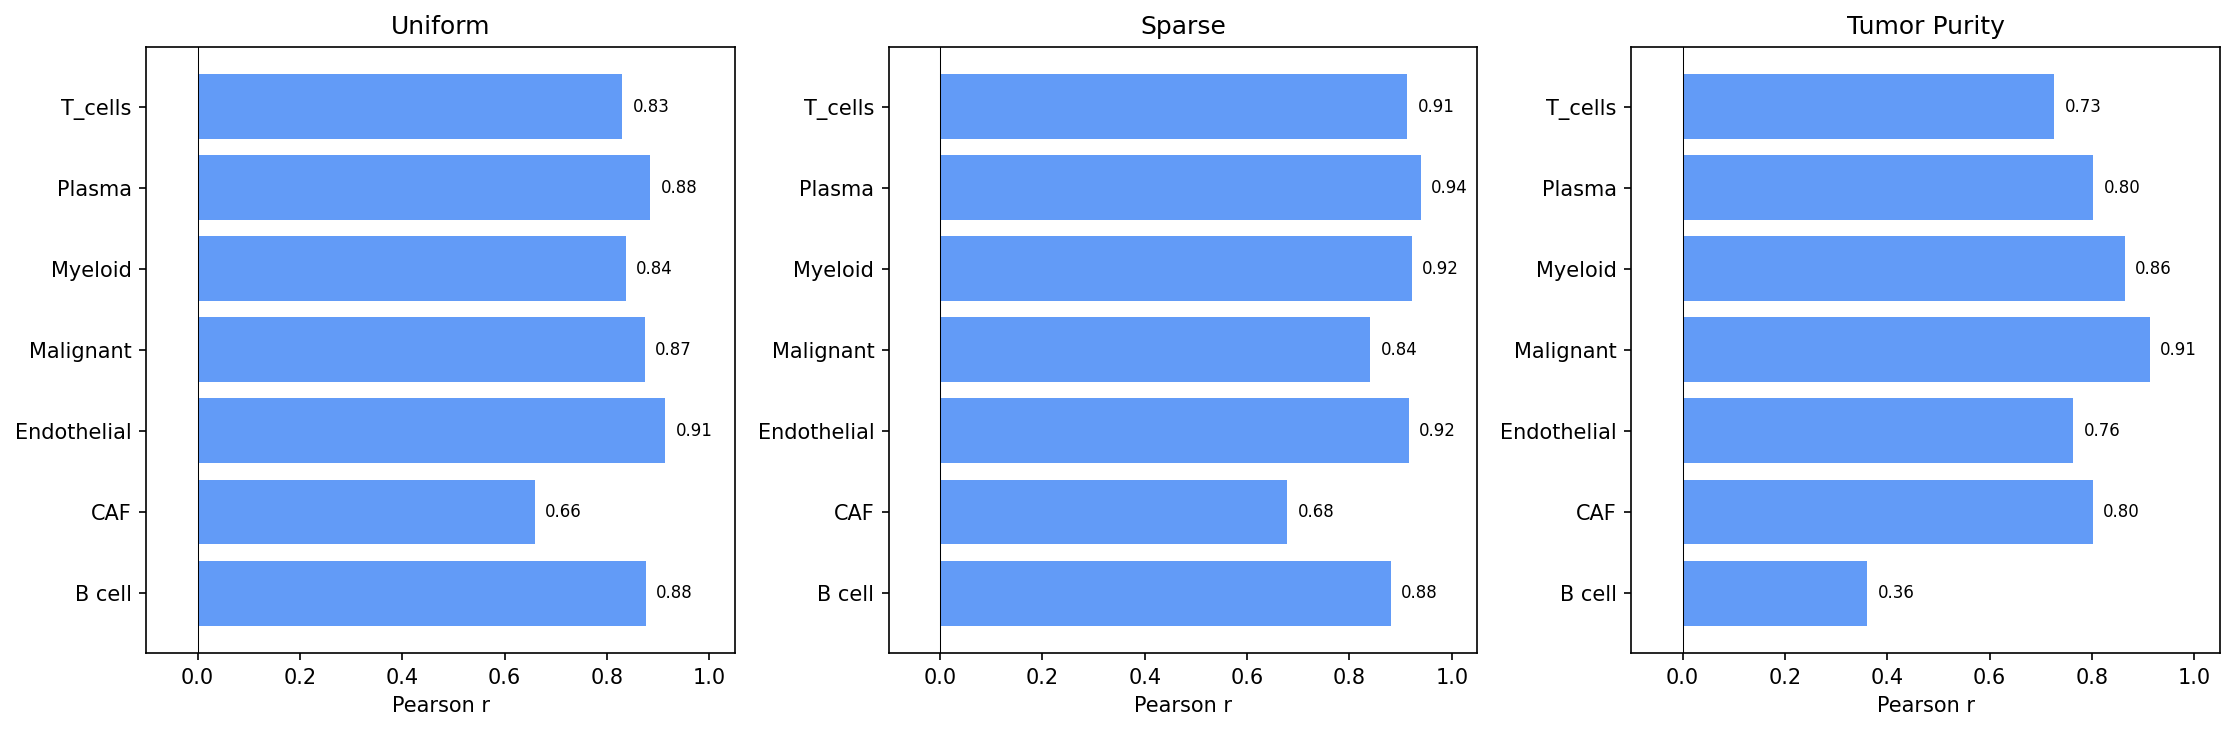
Per-cell-type accuracy. Pearson r is shown for each of the 9 cell types, averaged across the four scenarios. T-cells and Myeloid cells are recovered most reliably; Cancer Epithelial accuracy is scenario-dependent.
5. Reproducing
The full benchmark pipeline runs in four steps. All heavy compute should be submitted via SLURM — do not run GPU or R jobs on the login node.
# Step 1: Download Wu et al. data
sbatch scripts/slurm_download_brca_scrna.sh

# Step 2: Run SpaCET benchmark (GPU)
sbatch scripts/slurm_tutorial_t8_real_brca.sh

# Step 3: Run MuSiC benchmark (R)
sbatch scripts/slurm_music_benchmark.sh

# Step 4: Compare results
python scripts/compare_spacet_music.py
Step 1 downloads GSE176078 from GEO and formats it as an AnnData object. Step 2 runs the subject-level split, pseudobulk generation, and SpaCET deconvolution on GPU. Step 3 runs MuSiC in R using the identical train-set reference and pseudobulk inputs written by Step 2. Step 4 loads both result files and produces the comparison table and figures shown above.